
-
CT
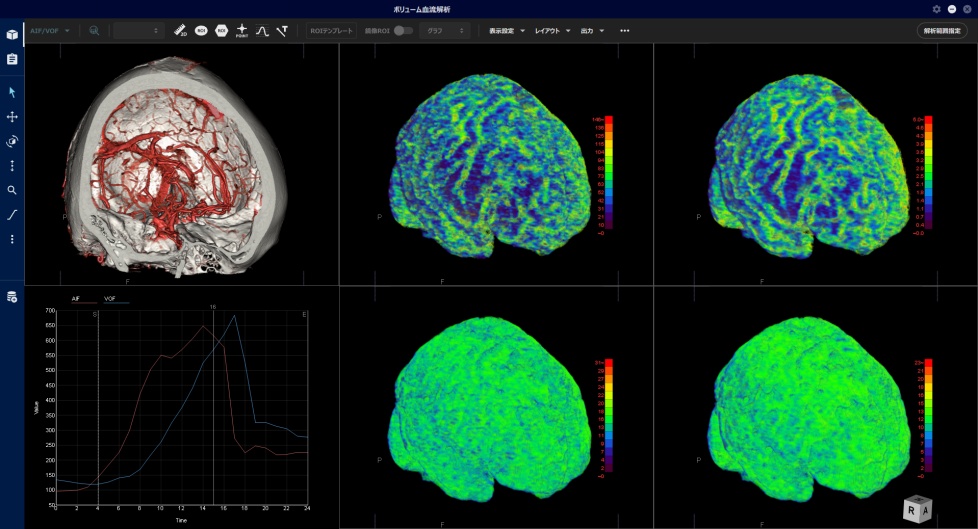
CT Volume Perfusion Analysis
The Volume Perfusion Analysis protocol is designed to graphically display differences in spatial distribution of contrast agent over time, representing differences in blood perfusion to tissues of interest as parametric maps. Several distinct perfusion-related parameters are available, and can be displayed in arbitrary planes of orientation.
The available algorithms are: standard SVD (sSVD), block-circulant SVD (bSVD), Single Compartment (SC), and Maximum Slope. Perfusion maps of BF (blood flow), BV (blood volume), TTP (time to peak) calculated from the time density curves (TDC), and MTT (mean transit time) (1st moment MTT), Tmax (time to max), Tau (blood mean transit time from arterial input function), Fv (blood flow) and R2 (coefficient of determination) are provided. -
CT
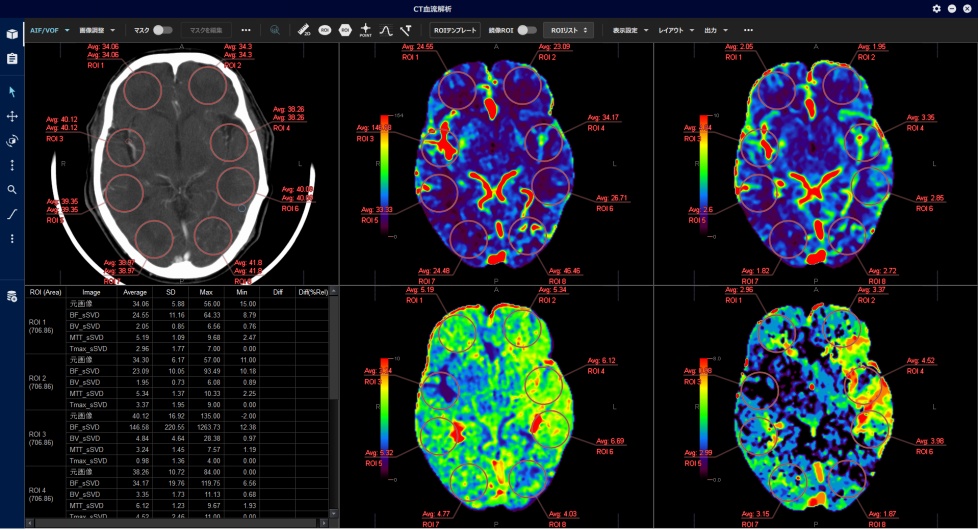
CT Perfusion Analysis
The CT Perfusion Analysis protocol is designed to graphically display differences in spatial distribution of contrast agent over time, representing differences in blood perfusion to tissues of interest as parametric maps. Several distinct perfusion-related parameters are available for display in axial planes.
The available algorithms are: standard SVD (sSVD), block-circulant SVD (bSVD), Single Compartment (SC), and Maximum Slope. Perfusion maps of BF (blood flow), BV (blood volume), TTP (time to peak) calculated from the time density curves (TDC), MTT (mean transit time) (1st moment MTT), Tmax (time to max), Tau (blood mean transit time from arterial input function), Fv (blood flow) and R2 (coefficient of determination) are provided. -
MR
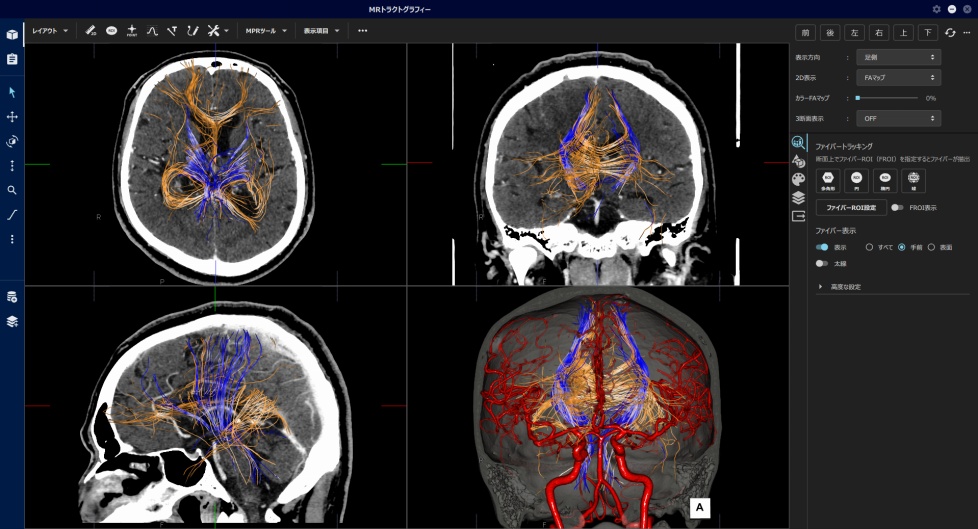
MR Tractography
The MR Tractography protocol is designed to open DTI (diffusion tensor imaging) data and show fibers which go through or avoid specified FROIs (fiber ROIs). The fibers can be colored by groups as desired.
-
MR
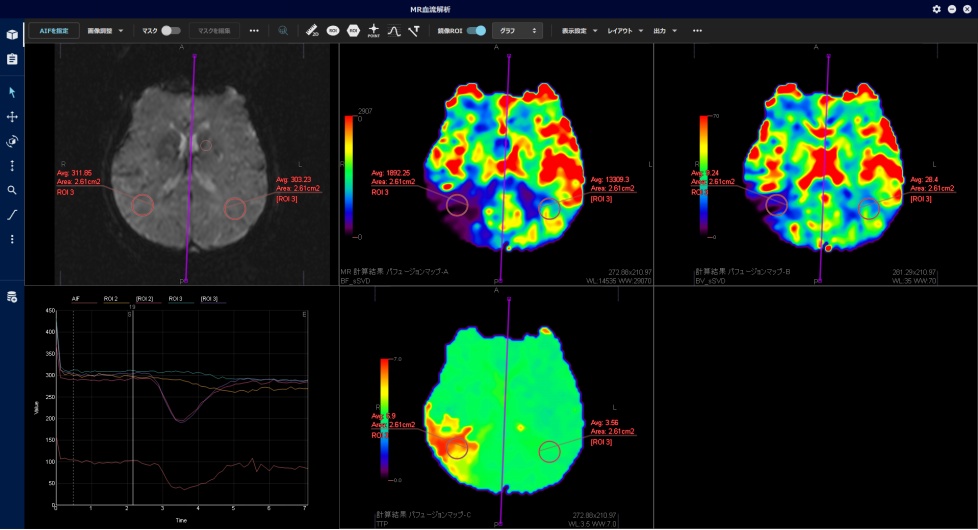
MR Brain Perfusion Analysis
The MR Brain Perfusion Analysis protocol is designed to analyze the blood flow through brain vasculature and graphically display differences in spatial distribution of contrast agent over time, representing differences in blood perfusion to tissues of interest as parametric maps. Several distinct perfusion-related parameters are available for display in axial planes.
The available algorithms are: standard SVD (sSVD), block-circulant SVD (bSVD), Single Compartment (SC), and Maximum Slope. Perfusion maps of BF (blood flow), BV (blood volume), TTP (time to peak) calculated from the time density curves (TDC), MTT (mean transit time) (1st moment MTT), Tau (blood mean transit time from arterial input function), Fv (blood flow) and R2 (coefficient of determination) are provided.
- Speciality
- Head
- Dental
- Cardiac
- Thoracic/Breast
- Abdominal
- Extremity/Spine
- All-around
Sort protocols
- Speciality
- Head
- Dental
- Cardiac
- Thoracic/Breast
- Abdominal
- Extremity/Spine
- All-around