
-
MR
MR Myocardial Strain Analysis
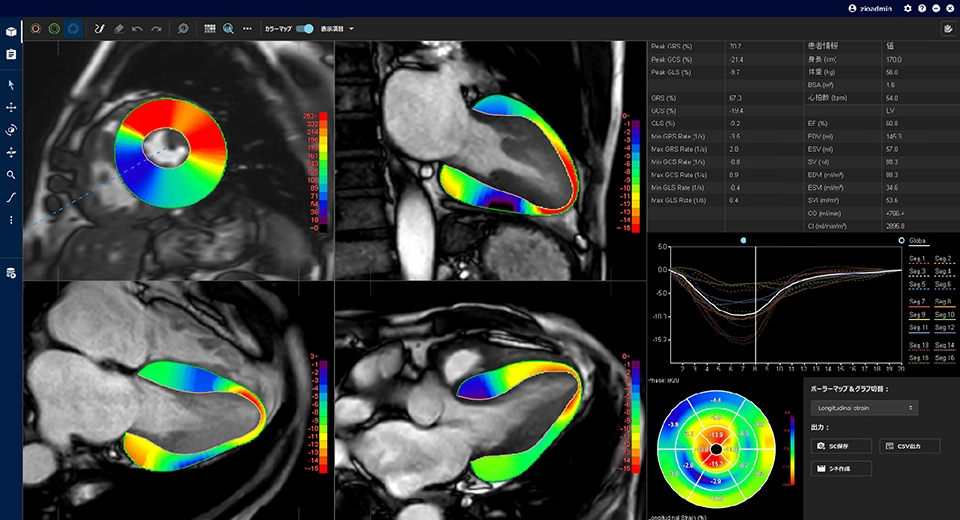
The MR Myocardial Strain Analysis protocol measures myocardial strain (radial strain, circumferential strain, and longitudinal strain) using ECG-gated, multi-phase cine MR heart data.
-
MR
MR Myocardial T2 Mapping
Using MR heart data with different TEs, this protocol draws T2 relaxation curve, measures and maps T2 values.
-
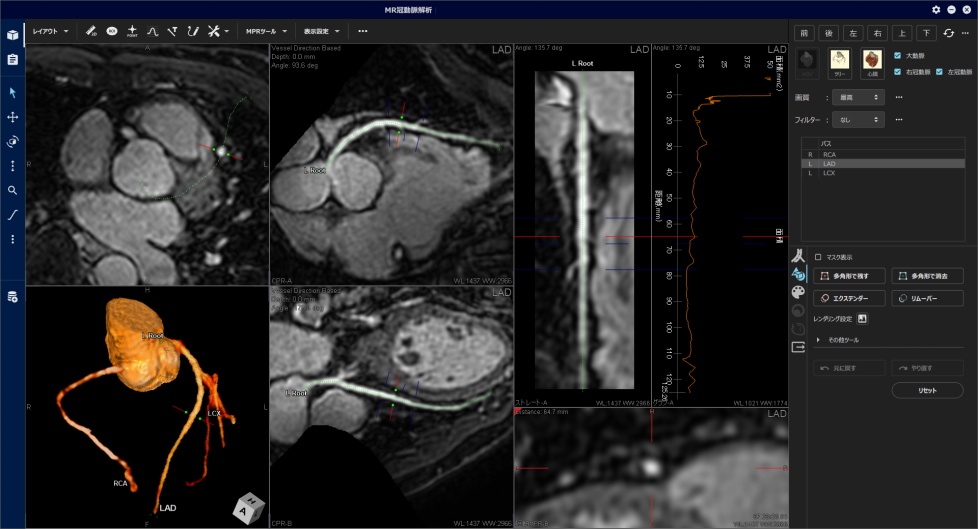
MR
MR Coronary Analysis
The MR Coronary Analysis protocol is designed for quick assessment of coronary artery patency. Automated centerline detection and measurements simplifies workflow. It supports customizable labeling of arteries for review in CPR, straight CPR view, MPR, and MIP/VR/FS MIP (Flex Surface MIP). Intuitive editing of centerlines lead into automated calculation of vessel stenosis using area and length methods for analysis.
-
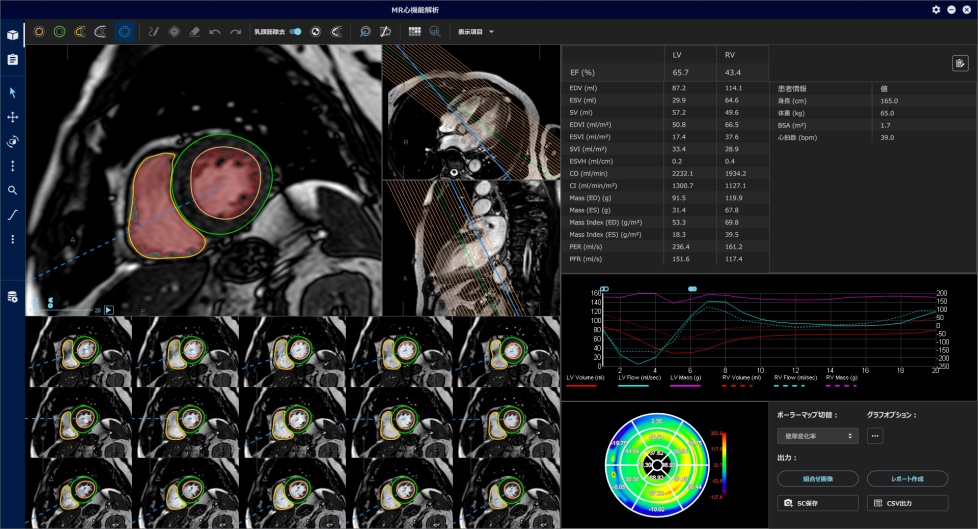
MR
MR Cardiac Function
Utilizing multi-phase MR heart data of one cardiac cycle, the MR Cardiac Function protocol extracts endocardial and epicardial contours of the left ventricle, and calculates left ventricular ejection ratio (EF), wall thickness, thickening, wall motion, etc. Right ventricular ejection ratio (RVEF) can also be calculated.
-
MR
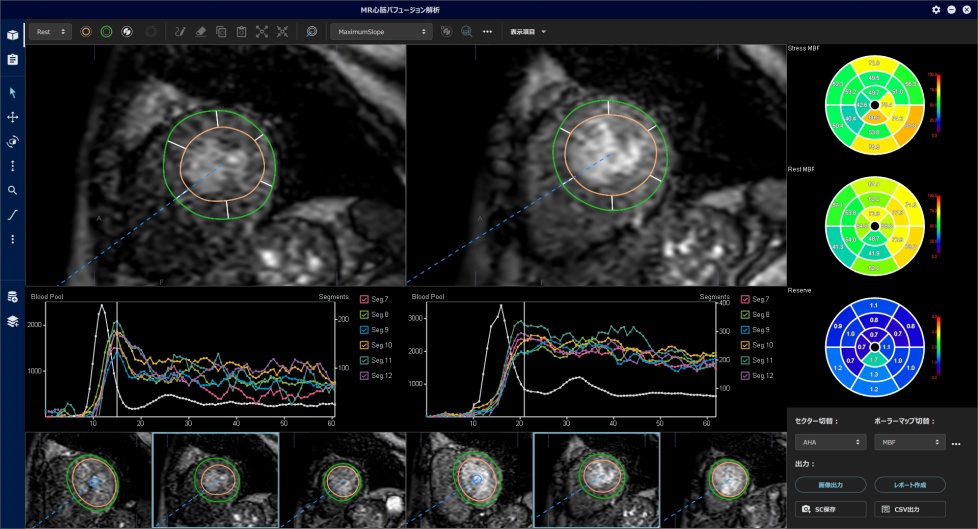
MR Myocardial Perfusion Analysis
Utilizing the dynamic MRI cardiac scan data obtained at rest and during stress, MR Myocardial Perfusion Analysis quantitatively/semiquantitatively and visually evaluates the state of myocardial blood flow using multiple analysis methods. It can also measure and visually map myocardial blood flow (MBF), time to peak (TTP), myocardial flow reserve (MFR), etc.
-
MR
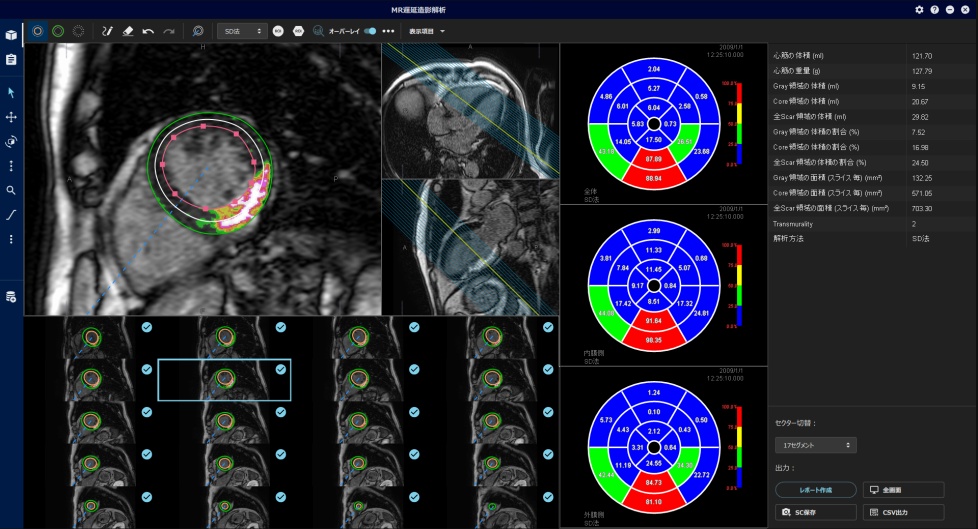
MR LGE Analysis
The MR LGE Analysis protocol measures the range of high signal value areas from MR delayed contrast data, and visually maps the ratio of each segment to area.
-
MR
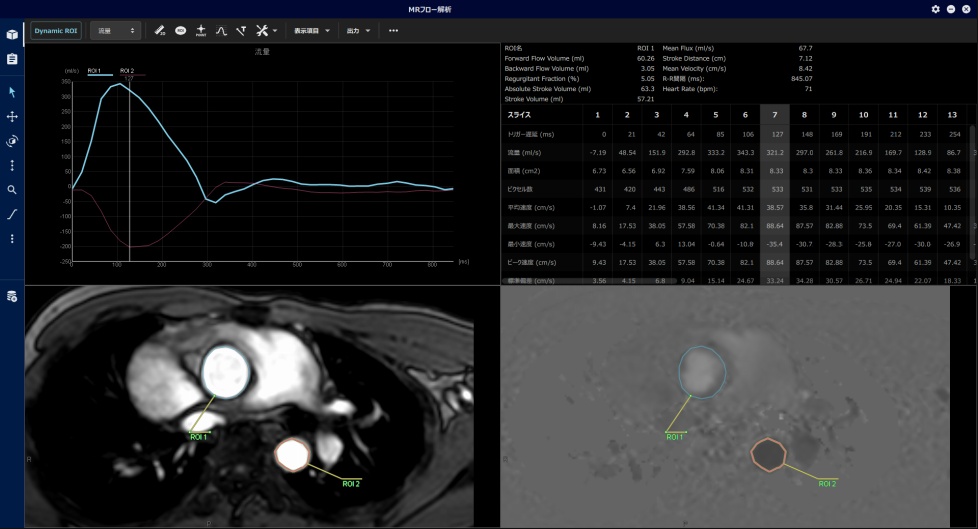
MR Flow
The MR Flow protocol is designed to evaluate flux and velocity of the specified vessel using phase contrast MR images.
-
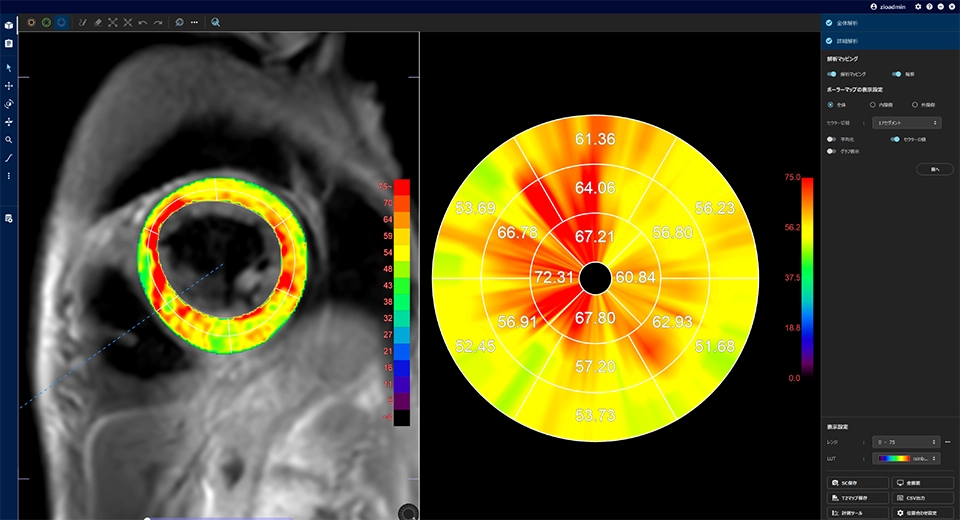
MR
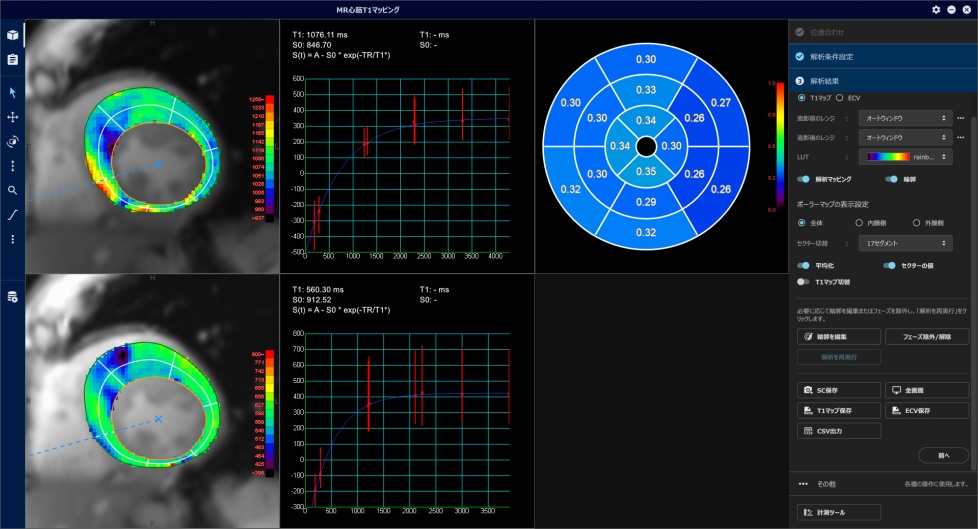
MR Myocardial T1 Mapping
Using MR heart data scanned with different TI (Inversion Time), this protocol extracts endocardial and epicardial contours of the LV, and shows color maps of T1 values calculated from the T1 relaxation curve. When pre- and post-contrast data are opened, this protocol shows ECV (extracellular volume) calculated from hematocrit and blood T1 values.
- Speciality
- Head
- Dental
- Cardiac
- Thoracic/Breast
- Abdominal
- Extremity/Spine
- All-around
Sort protocols
- Speciality
- Head
- Dental
- Cardiac
- Thoracic/Breast
- Abdominal
- Extremity/Spine
- All-around